Gold drops 30%, silver plunges 54% — but history shows 2026 correction isn’t the deepest yet — SkimNews

Get the Finance newsletter
Daily finance — markets, central banks, M&A, the prints that move money. Free.
- Gold fell to $3,942/oz from its January 2026 all-time high of $5,602/oz, a roughly 30% drawdown that remains shallower than the 71% collapse after the January 1980 peak, which took 19 years and 7 months to bottom.
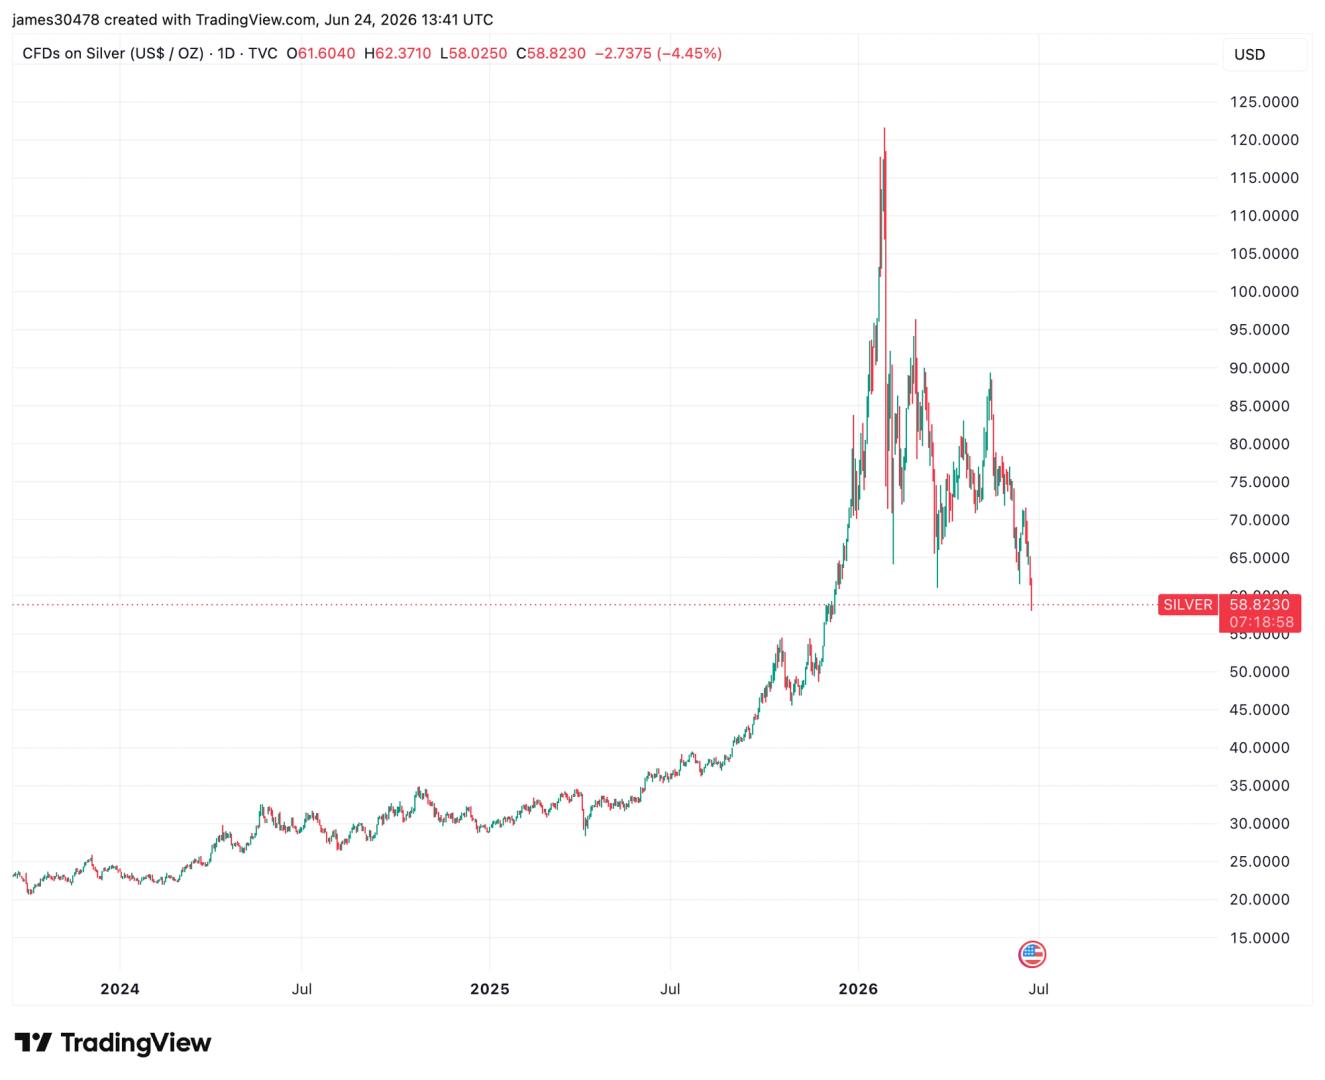
- Silver plunged to $55.6/oz from $121.6/oz — about 54% — compared with the 93% post-1980 crash that needed over 11 years to find a durable bottom and 31-plus years to reclaim its prior high.
- The DSP Netra July 2026 report catalogs prior gold corrections of 49% (after December 1974), 34% (March 2008), and 46% (September 2011), and silver drawdowns of 27% (August 1975) and 77% (April 2011).
- Both metals crossed the 25% drawdown threshold within one to two months of their January 2026 peak, but the report flags that the durable bottom and recovery timeline remain undetermined.
- The pre-2026 rallies were 435% for gold and 945% for silver — strong but trailing the 773% gold surge and 1,158% silver surge that preceded the 1980 drawdown, and the 1,340% silver rally before the 2011 peak.
- The report concludes that "drawdown analysis shows severe price damage, but time correction is still pending," noting historical recoveries to prior record highs have stretched into decades.
Why it matters: Precious-metals holders face a correction already 30-54% deep, yet by the DSP Netra benchmarks it still sits below the median historical drawdown — the 1980 gold crash alone required 19.6 years to bottom and 28 more to recover its old high. That framing makes the magnitude familiar but pushes the open question to duration: how long before the 2026 cycle finds a durable floor and how many years before gold and silver reclaim $5,602 and $121.6.
Ask SkimNews